
The Great Car Price Hunt: Navigating the Seas of Prediction (Part 3)


1. Introduction
In the first two parts of our captivating series, we embarked on a grand journey - weaving through the dense jungles of web-scraping, taming the wild beasts of raw data, and sailing the seas of exploration, discerning the patterns that hide beneath the waves of the Hungarian used car market.
Equipped with the insights from our exploratory data analysis, we will construct a model that not only predicts car prices but also unravels the mystique behind its decisions. Furthermore, we're setting it free, so that anyone, anywhere, with a mere link from hasznaltauto.hu can get a glimpse of a car's predicted price, complete with an enlightening SHAP explanation. Try the API here.
2. Modeling the Data: Diving Deep into Catboost and Beyond
Preparing the Data: The Final Touch-Up
Before our car price prediction model can start its training, we need to ensure that the data it learns from is of the best quality.
- Targeting Regular Cars: Our primary goal is to predict the prices of regular cars. While some exotic and luxury cars can skew the price distribution with their exorbitant prices, for the purposes of this study, cars priced above €100,000 are capped at that price based on the previous post. This ensures we don't deal with a heavy-tailed distribution, making our predictions more robust.
- Transforming the Target Variable: Even after capping, car prices have a vast range. To provide our model with a more linear relationship, we transformed the prices into logarithmic form. This transformation has the added benefit of stabilizing variances and making our model more resilient to outliers.
- Handling Categorical Variables: In our dataset, some categories within the categorical columns had very few samples. We bundled categories with less than 1,000 samples into an "Other" category. We also dropped features with extremely low or high cardinality to reduce noise and ensure our model remains focused on the most influential factors.
Train Catboost model
As we set out on our modeling journey, our choice of algorithm was both strategic and informed. Catboost is a gradient-boosting algorithm that is specifically tailored for datasets with many categorical features. Unlike other gradient-boosting algorithms which require manual preprocessing of categorical variables, Catboost handles them natively, saving time and potential errors in encoding.
With the stage set and Catboost ready to go, we took the plunge:
Data Partitioning: We divided our dataset into an 80-20 train-test set, ensuring a representative sample of our data in both portions.
Feature selection: Not all ~300 features equally contribute to the prediction. Using Catboost's built-in feature importance, we retained only the top 50 features from an initial model without any drop in the metrics.
Model Performance At-a-Glance: On the log-transformed prices, the MAPE stands at a mere 0.72% for training and 1% for testing. In contrast, when reverting to the original prices, the MAPE rises to 11.06% on the training set and 15.36% on the test set. Although the results are promising, they also hint at potential avenues for model refinement when considering real-world pricing predictions.
OpenAI DALLE-2: “Sleek sports car racing towards a lit city skyline at twilight with a cinematic vignette modern art”
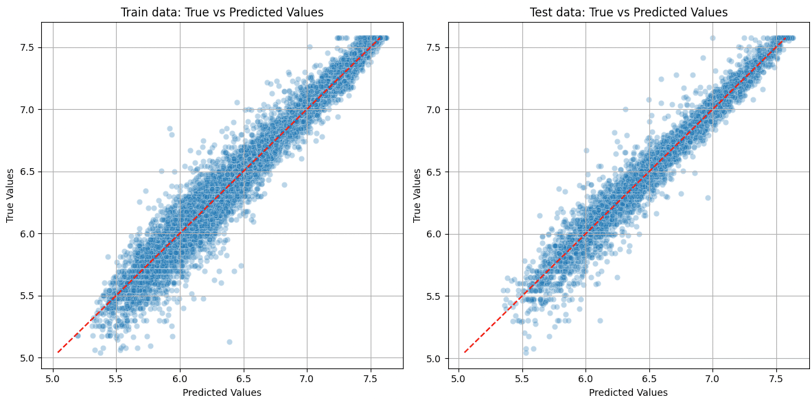
Fig. 1. Comparing predicted and actual price values in a scatter plot.
We also embarked on a parallel journey with AWS Autopilot. To our intrigue, Autopilot steered its ship towards another gradient-boosting algorithm: XGBoost. And guess what? The performance was neck and neck with Catboost. So our current dataset, which stands at ~30 thousand samples, is probably the best achievable model at this point. But this is just the tip of the iceberg, we are in the process of amassing more data, and as the size of our dataset grows, we're optimistic about refining our model to even greater precision.
Yet, it's essential to recognize a crucial aspect of our investigation: not every trait that determines a car's price might be explicitly listed. There might be hidden problems, brand perceptions, and sometimes, plain old sentimental value, which plays a role in price determination. Part of our exploratory mission is to identify cars that might be mispriced — those hidden gems that are potentially underpriced.
3. Understanding the Model: SHAP Values
Ever looked at your model's predictions and thought, "Why on Earth did it think that?" Enter SHAP (SHapley Additive exPlanations), the Sherlock Holmes of machine learning interpreters!
Key notes about SHAP:
Origin Story: SHAP finds its roots in cooperative game theory. Imagine players in a game, each contributing differently to the team's victory. SHAP essentially figures out "who brought what to the table".
Blending Intuition with Mathematics: At its core, SHAP values tell us how much a feature pushes the prediction from the baseline (or average prediction). Positive SHAP values? That feature nudged the prediction up. Negative? It's like the feature said, "Nah, let's go a bit lower".
Examples of how the model exactly decides the price of a car are down there later!

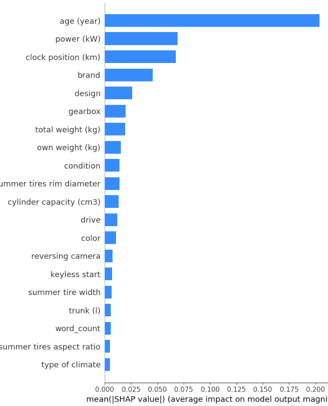
Fig. 2. SHAP summary plot. We can interpret the average SHAP values relative to each other to determine what are the most important features.
Diving into the intricacies of our model, the feature importance summary offers a window into which attributes most influence a car's price in our dataset.
1. Top Influencers: These rankings corroborate industry understanding – the age of the car, its power, and the distance it's traveled are crucial determinants of its market value.
2. Brand and Design: Car enthusiasts would resonate with the significance of brand and design as defining elements.
3. Technical Aspects: Features like total weight (kg), gearbox, and drive each with importances ranging from 1.3% to 1.9% reveal the model's nuanced understanding. Subtler elements like the `reversing camera` or the presence of a `keyless start` system also find their place, emphasizing the shift in modern-day car valuation towards tech integrations.
4. Textual Data's Role: It's particularly fascinating to note the role of text-derived features like word_count and various TF-IDF features (they didn't fit on the summary plot). The model has successfully harnessed the nuances of descriptions and technical details to refine its predictions.
5. Lesser, but Not Insignificant: As we traverse down the list, features like color, type of climate, or fuel have lower importance but can collectively sway the model's decisions. Even if they individually hold less weight, in tandem, they craft a detailed portrait of the car.
Diving deeper into the contribution of features
To truly appreciate the model's learning, Some boxplots, and SHAP dependence plots were created for the most important features. These visuals let us compare actual relationships with what the model understands. For instance, while older cars generally decrease in value, vintage cars (over 30 years) can witness a slight surge in pricing, especially those over 60 years old.
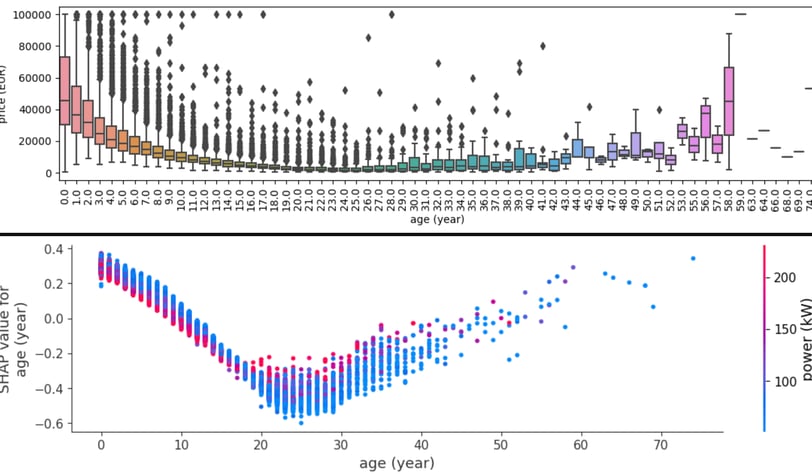

Fig. 3. Box plot of price for each age value and related SHAP dependence plot.

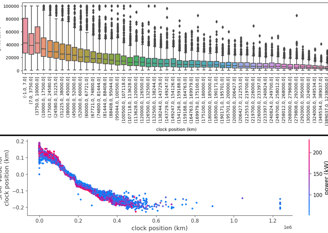
Fig. 4. Power relation with price and SHAP
Car Brands & Design
Now, let's look at the relationship between some categorical features and their associated prices and how well our model has learned the relationship between these factors.
When we glance at the data, the hierarchy in average prices is quite clear. Luxury brands like 'Mercedes-Benz', 'BMW', and 'Audi' command higher average prices compared to mainstream brands like 'Ford' and 'Opel'. This aligns with what one might expect in the real world.
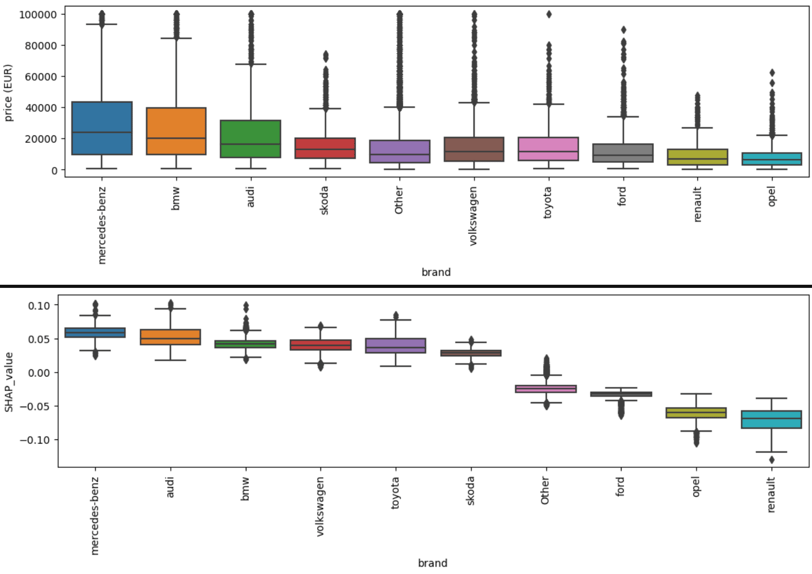
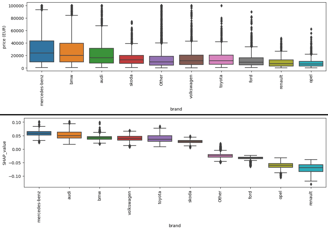
Fig. 5. Brand relation with price and SHAP
Most of the other features have a simple linear-like relationship with the price prediction. As you can see on power and clock position SHAPs.
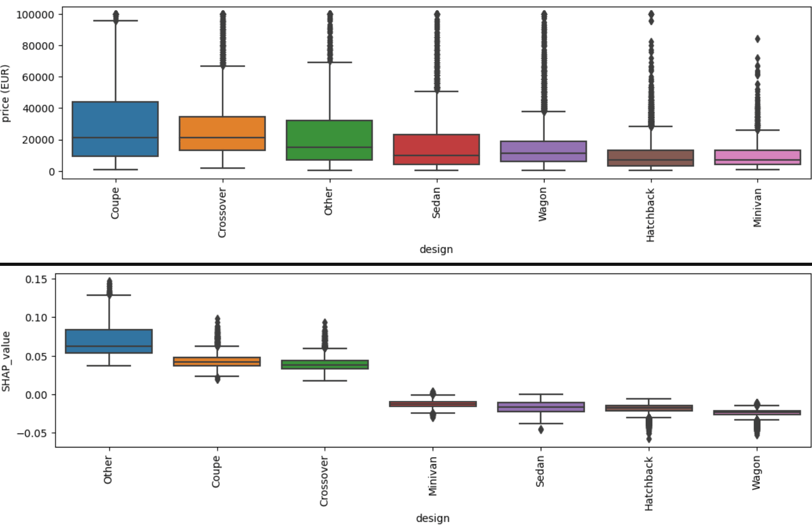
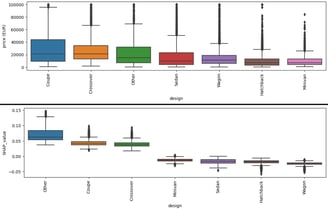
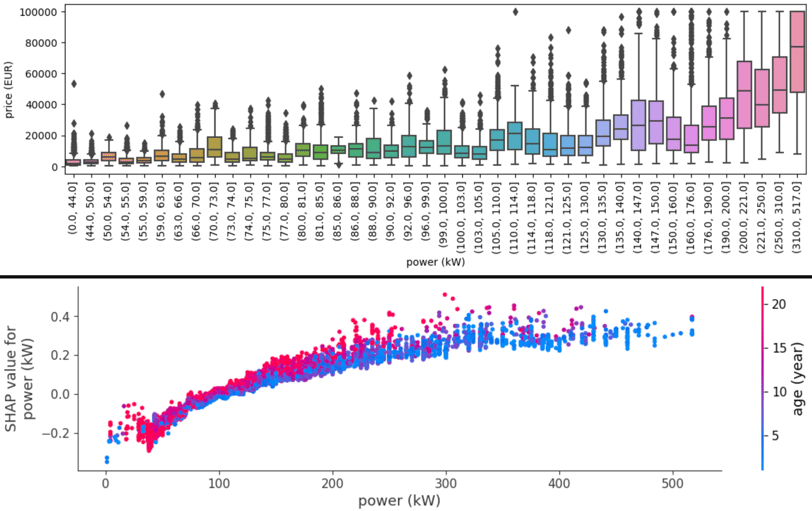
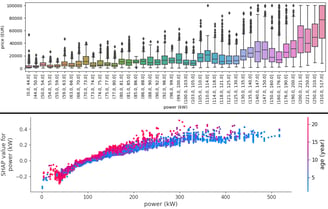
Fig. 5. Clock position relation with price and SHAP
Fig. 6. Design relation with price and SHAP

On the design front, 'Coupe' and 'Crossover' designs stand out with higher average prices, while designs like 'Hatchback' and 'Wagon' are more modestly priced.
Average SHAP vs. average price
Just like with brands, most design SHAP values align with the price but as you can see in the plots it is not always the case. The discrepancy between the order of average car prices and their associated SHAP values arises from the intrinsic nature of SHAP values and how models make predictions. SHAP values don't directly explain the price of cars! It just tells you how the model learned the relationship between the feature and the target value in the presence of all other features.
5. Diving Deeper: Individual Car Analysis
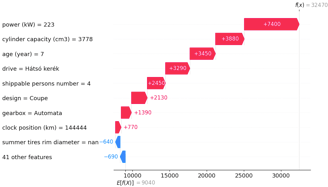
To further explore the model's decision-making, I analyzed two specific cars where our predictions differed from actual prices. These 'waterfall plots' break down the feature contributions for 2 cars where the difference between the prediction and actual price is the highest. Note that the SHAP values for this plot are converted to the power of 10, so now the +/- numbers show the feature impact on the predicted price in EUR!
Car 1 - Hyundai Genesis: With features like a 7-year age and 223 kW power this coupe is the perfect sports car and its price is only €10.6K while the predicted price is €32.4K.


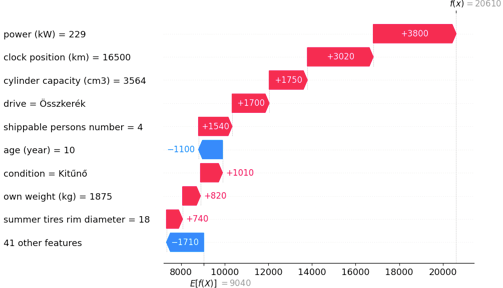
Car 2 - Cadillac CTS: A 10-year-old model with a surprisingly low mileage of 16,500 km. It's a huge, powerful car in excellent (kítűnő) condition with all-wheel drive (összkerék). The price of it is only €11.7K while the predicted is €20.6K.
Fig. 7. Waterfall plot to understand the price prediction for the Hyundai Genesis. From down to up the SHAP impacts are added to the expected price (average price) and eventually, we get the final prediction.
Fig. 8. Waterfall plot to understand the price prediction for the Cadillac CTS.
Note that the SHAP values are related to the log price prediction, so the exponential relation between the price and the age seems more linear in the SHAP plot. So the SHAP values represent how the age pushes the log prediction up or down.
6. Conclusion
Are our predictive models the definitive guide to pinpointing underpriced cars? The answer remains elusive. While the predictions can offer guidance, unseen factors not evident in advertisements might sway a car's true value. However, they provide a lens to filter potential bargains in a sea of options.
To refine our approach further:
If we assume that good deals are sold faster we can check how the predicted price difference correlates with the time the advertisement is alive.
We're harnessing a growing dataset as new cars are continuously added to our collection.
Enhanced text analytics might unearth critical insights from descriptions, perhaps leveraging large language models (such as Llama) for evaluative scores.
Delving into supplementary data, such as car histories via chassis numbers, might illuminate recent repairs influencing pricing.
For a firsthand experience of our model's prowess and interpretative SHAP plots, explore our API here.